Slope Fit and Measure — ImageJ macro
Quick links
Slope fitting and measurement into table
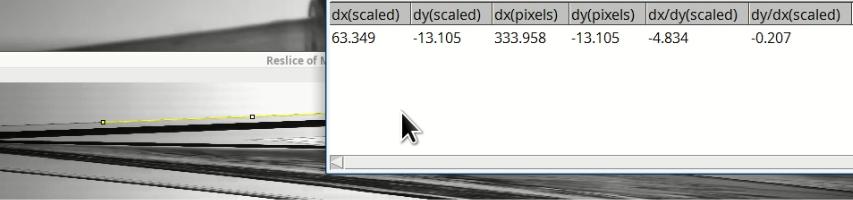
This plug-in is designed to interactively measure slopes on images. It provides a tool to draw a line selection onto an image, and two keyboard shortcuts. The first shortcut triggers a fit procedure to improve the adjustment of the line selection to an intensity step or peak in the underlying image data. The second logs the slope measurement to a table, which can then be exported in CSV format for further processing.
For questions and some (limited) support see the following discussion on the ImageJ forum: https://forum.image.sc/t/line-selection-tool-for-kymograph-velocity-measurement/32723
Video introduction
ImageJ/Fiji can do that already, can’t it ? Why this tool ?
One can indeed measure the orientation of some feature using the
existing line selection tool, and either read the angle shown live in
the main window, or use the Measure tool in the Analyze menu to
log the angle to a measurement table.
This tool is nevertheless interesting for two reasons:
-
In some cases you are more interested in the slope than in the angle. Of course computing the tangent or cotangent of the angle will get you the slope, but it requires one processing step that slows your measurement process. Moreover the horizontal and vertical measurement intervals - or the length of the fitted line segment - are lost in this process, and thus estimating the uncertainty from the angle alone is impossible. A typical case is the measurement of a velocity on a space-time diagram (also called a strip-videograph or kymograph), see video example below.
-
The precision you get from adjusting the line by eye and mouse is limited, not least by the fact that your line selection endpoints move in steps determined by your screen resolution and zoom level when positioned manually. This tool can attempt to fit the line more closely to the underlying pixel data.
Installation
- Download
SlopeFitAndMeasure.ijminto themacros/toolsetsfolder of your ImageJ/Fiji installation. If you don’t know where that is use the menu itemPlugins→Macros→Install..., then- choose the downloaded file
- when asked for the destination folder navigate one directory level up from the plugins folder,
- and then into the
macros/toolsetsfolder. - confirm
Below is a screencast of this installation procedure.
-
Restart ImageJ / Fiji.
- Show toolset by clicking on the rightmost tool button ≫ in the
main menu, and tick the box to the left of
SlopeFitAndMeasure.
Installation video
Usage
Click on the tool icon in the main ImageJ window, then draw a line selection. The status bar in the main window shows the line’s horizontal and vertical increments.
Two keyboard commands are available while the tool is active:
-
l(LATIN-SMALL-LETTER-L) will write the current line selection properties (dx,dy and slope) into a table. Holding the<Alt>modifier while pressing the key (combination<Alt>-l) instead removes the last entry from the table. -
kwill improve the alignment of the selection with the structure in the underlying image. The macro tries to be smart about what in the pixel data represents the line-like structure that we should align with: a bright→dark or dark→bright intensity step (edge), a bright line on dark background or a light line on dark background will all be recognized as linear structures for the purpose of fitting. You are encouraged to press this key several times in a row: the line will most of the time converge to a stable position within two to five iterations.
Usage video 1 — sandpile slopes
Hit the full screen button (typically lower right corner) to see the details, best viewed with a screen resolution of 1920x1080 or more.
Usage video 2 — velocity measurement on space-time-diagrams / kymographs / strip-videographs
Author, copyright, distribution policy and disclaimer
Copyright 2020,2025 Jan Eglinger & Adrian Daerr
This macro is distributed under the GNU General Public Licence, version 3. The licencing text can be found on the site of the Free Software Foundation at http://www.fsf.org/
If you require another licence please contact the authors.
THERE IS NO WARRANTY FOR THE PROGRAM, TO THE EXTENT PERMITTED BY APPLICABLE LAW. THE PROGRAM IS PROVIDED “AS IS” WITHOUT WARRANTY OF ANY KIND, EITHER EXPRESSED OR IMPLIED, INCLUDING, BUT NOT LIMITED TO, THE IMPLIED WARRANTIES OF MERCHANTABILITY AND FITNESS FOR A PARTICULAR PURPOSE. THE ENTIRE RISK AS TO THE QUALITY AND PERFORMANCE OF THE PROGRAM IS WITH YOU. SHOULD THE PROGRAM PROVE DEFECTIVE, YOU ASSUME THE COST OF ALL NECESSARY SERVICING, REPAIR OR CORRECTION.
Last modified: 26 Aug 2026